The Power of Census Data
27 Dec 2019

The last census that the US conducted cost the country $13 billion. It is no surprise that the census data is important.

So, what is the census?

The census is mandated to be carried out every 10 years by the US constitution. It counts all people – citizens and non-citizens. It is also mandatory to respond to the census so that the government will have an accurate count of the population. This serves as the backbone of fair political representation and it plays a role in many other areas of public life.

The information that is produced by the census is some of the most reliable data that exists because it is the only research study that encapsulates the entire population of the United States. As a result, companies including market research firms find this information vital. The statistics provide information such as gender, age, and household income. Also, it is possible to drill down the data by state, country, city, or even zip code.

Below are some examples of how market researchers use the extremely useful resource of census data:

Quotas

Market researchers use the census break down of the population to ensure that their sample is representative of the demographic make-up of the population that the study is targeting. In some cases, researchers use a sampling technique called weighting to help ensure accuracy.

Projections

When conducting survey research, often new segments or audiences are found. Using the census information, a researcher can calculate an estimation of the size of the population.

Where to Find the Census Information

The Census data is easily accessible to everyone. It is data that you have free access to, no matter who you are. The information is readily available here data.census.gov

The platform was recently updated and now includes several tools to analyze the data. Below outlines how to use the new website.

How To Use the New Census Database

The new census database makes it easy to find what you’re looking for with a table of options to mix and match from. There are a couple of ways to start your search. For example, if you are looking for general demographics and all of the different census surveys, click on the “View Tables” option on the home page. This will come up with a table and an option to pick a particular survey to view. This is the simplest way to get the general information if that’s what you are looking for.

census webpage

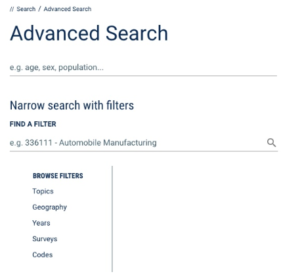
On the other hand, if you are looking to dig deeper into a particular category, use the advanced search, shown in the figure above. There is a range of filters for you to look at it, including years and geography. Within the geography, you can make your search as broad as the whole country, and as granular as a census tract, giving you many options.

Topics are within these filters, where you can choose between different categories, including the economy, education, employment, living arrangements, health, housing, and more. Once you choose a topic and geography, the platform will direct you to a corresponding table for what you picked.

The table feature is very easy to use. However, there are still a few glitches with downloading tables when you want to. Hopefully, because this is a new system, it will be fixed in the near future!

Sign up for our newsletters here!

Follow our social media accounts:

Twitter: https://twitter.com/provokeinsights

Facebook: https://www.facebook.com/provokeinsights/

LinkedIn: https://www.linkedin.com/company/provoke-insights

A New Way to Test Significant Differences
17 Dec 2019

Testing significant differences can often be complicated. Try our new, free, Significant Difference Calculator! Our new tool allows you to test differences between more than one subgroup at the same time. It also allows you to analyze multiple attributes at once. It is no longer a tedious process.

To summarize, this tool tests significance between sample proportions. The confidence levels provide the probability that the difference presented is at least as large as it would have been if the two population proportions were equal.

Using a pooled sample approach, our tool runs 2 proportion Z-tests, by taking sample size and percentages into account. It allows users to test tables of proportions against each other, as well as download the results.

Please feel free to try the tool, thank us for the free service by sharing it on social media! Follow the instructions and try out the Significant Difference Calculator below!


Lastly, although you came for significant differences, check out more from Provoke Insights below. Accordingly, here are some of our most recent blogs:

  1. Research Norms: What are they and what they can tell you
  2. How Black Friday Can Hurt Your Brand
  3. Why Trends are so Important in Marketing
  4. Experiential Marketing & Retail

Especially, sign up for our newsletters here!

In addition, follow our social media accounts for the latest Market Research news:

Twitter: https://twitter.com/provokeinsights

Facebook: https://www.facebook.com/provokeinsights/

LinkedIn: https://www.linkedin.com/company/provoke-insights

Finally check out our most recent features in the news media:

September 11th, 2019: 40% of U.S. Millennials prefer crypto investments in the event of a recession: eToro Survey

July 31st, 2019: Jewelry Is About to Get its Own ‘Got Milk’ Ads

July 1st, 2019: 22 Top Advertising Research Companies 2019

Enjoy our Significant Difference Calculator, and stay on the lookout for more blog posts from us!

Fin-Tech: How to reinvigorate your brand in a sea of sameness
10 Dec 2019

Robinhood is currently one of the fastest growing online trading platforms. It is popular among Millennials. The key reason – it is commission-free. The company administers fees in the backend. Robinhood set the standard in 2006 by following this market: reinvigorate the market.

However, the traditional DIY investing platforms – Charles Schwab, eTrade, and others have very recently moved to a commission-free method as well. As Robinhood’s unique selling proposition was “Free,” how will it distinguish itself from the competition? The slogan “Say goodbye to commission-free trading” no longer works.

Robinhood also promotes itself as easy to use, but so does the competition (see eTrade’s slogan “Choose E*TRADE for Easy Tools & Research”). For an online category, this sector needs reinvigoration. It might be time to take on research to refresh the DIY investing industry and attract new customers. Here are a few market research methods that could benefit Robinhood and the online investing industry generally.

Secondary Research

Secondary research on the market is vital to understanding what the next direction that your brand needs to differentiate from the rest. This type of research is information that is already out there- some are in the public space, but others exist in a database that you need to pay for. For example, you can use secondary to help evaluate current market trends, sales by different companies, and ad campaigns run by various companies.

When it comes to online investing, there is plenty of available research for Robinhood to separate themselves from the competition. Past advertising campaigns and website traffic of competitors might be one example.

Understand What Your Prospect and Customers are Looking For

DIY investing platforms need to move beyond the functional attributes of cost and ease of use. The key is to understand better who are their customers and what are their ultimate goals when it comes to investing. While older generations, such as Generation X and Baby Boomers, seek stability, many younger generations are more apt to want to save enough money to enjoy experiences. It is vital to understand millennials’ attitudes and how this will impact a fin-tech brand’s strategy. 

Primary research such as focus groups, in-depth interviews, and surveys help determine how to understand the market better. Conducting segmentation research, developing personas, and understanding current brand perceptions are important ways to position the brands better.  In other words, to reinvigorate the market, you have to understand brand perception.

What’s Next for Robinhood?

There is a slew of market research options to find out what the market needs if you want to reinvigorate your brand. When it comes to Robinhood, their success forced their competition to adapt and change their policy and product offerings. Well, now it’s their turn to adapt and to understand that it’s going to take an all-hands-on-deck research approach. What do you think Robinhood should do next? How should fin-tech companies promote themselves?

Want to read more from Provoke Insights, find some more blog posts linked below: 

  1. Research Norms: What are they and what they can tell you
  2. How Black Friday Can Hurt Your Brand
  3. Why Trends are so Important in Marketing
  4. Experiential Marketing & Retail

Read this excerpt for a blog from our series on Generation Alpha!

“Knowing your audience and prospects is a key way to improve your profitability! As a result, different generations have different behaviors, attitudes, and preferences. Thus, understanding the generation gaps will help you understand the needs of your customers. Generations give marketing strategists an easy way to target and focus their methods. 

Baby Boomers do not want to see texting acronyms; they are swayed by clear video, they care about their in-store experiences, and they like to compare prices. On the other hand, Millennials want to care about the product they’re buying, and want to have a positive impact on their community. In addition, Generation Z (those born after Millennials and before 2010) is most influenced by social media, as that’s where they receive most of their news.

There is a new generation on the block! Brands need to know how this audience differs from their current audiences. Provoke Insights will be releasing a three-part blog series to help marketers understand the newest generation, to reinvigorate interest. Generation Alpha, the children of Millennials, are making waves recently in the news. Coupled with their Millennial parents, a marketing buzz has started to precipitate around the arrival of these youngsters. But how do they differ from their parents? In other words, what differences will there be in marketing to Generation Alpha versus marketing to Millennials?”

Sign up for our newsletters here!

Follow our social media accounts:

Twitter: https://twitter.com/provokeinsights

Facebook: https://www.facebook.com/provokeinsights/

LinkedIn: https://www.linkedin.com/company/provoke-insights

Check out our most recent features in the news media:

September 11th, 2019: 40% of U.S. Millennials prefer crypto investments in the event of a recession: eToro Survey

July 31st, 2019: Jewelry Is About to Get its Own ‘Got Milk’ Ads

July 1st, 2019: 22 Top Advertising Research Companies 2019

Keep on the lookout for more blog posts from us!

Research Norms: What are they and what they can tell you
05 Dec 2019

What are Research Norms? 

You have a survey result that says 67% of respondents state that the advertisement shown in the research is unique. What does that mean? Is that good compared to ads that are currently out there? That is where norms come in! 

In market research, norms (also called normative data or benchmarks) are established baselines to compare your data against. It allows you to determine if the results are above or below par. They are particularly popular in advertising and brand testing.

Going back to our initial example, two-thirds of respondents stating the ad is unique sounds excellent. But what if the norm for uniqueness is 80%? Consequently, 67% doesn’t sound so great anymore!

How Do We Get Norms?

To calculate and properly use norms, you have to use the same survey method and phrasing each time you run a survey. That way, the variables are the same over time, and there isn’t bias in your calculations. 

Norms can be established in multiple ways. You can have benchmarks against previous waves of your own research. A market research vendor can have an aggregate of all the surveys commissioned by clients that ask the same questions. These norms can also be sorted by industry.  

How Do We Use Norms?

We use norms to interpret the state of the market and how advertisements or concepts test relative to other ads or campaigns, respectively. 

Norms give market researchers the context to fully understand, interpret, and present new results based on the same standards. When working with a market research company, it’s essential to ask about the norms in their directory. If they do have norms you are looking for, you may want to include those norms in your survey. At Provoke Insights, we have a growing norms database, with answers on a wide range of attributes in an assortment of industries.

Issues with Norms

As with any market research method, if you aren’t too careful, you may misinterpret survey results and commit unfortunate blunders. From changes in trends to norms not testing the full competitive landscape, may negatively impact using these benchmarks. A blog post published by the Insights Association does outlines the issues to look out for when it comes to collecting and interpreting norms.  

However, overall norms can be beneficial in better understanding of how brands and advertisements compare against the rest of the market.

Want to read more from Provoke Insights, find some more blog posts linked below: 

Why Trends Are So Important In Marketing

Experiential Marketing & Retail

Check out an excerpt from our blog on why trends our important in marketing below!

“Let’s go back a few years to 2007. Especially, why don’t we think about GPS technologies. Back in the day, Garmin and TomTom were the two biggest GPS technology producers, and both were paid for services. But, both brands were sideswiped by Google who began offering free navigation via an iPhone app and on the web. As a result, in just 4 weeks, the valuation of these companies dropped! Can you imagine if these navigational systems had followed the trends that were happening outside of their narrow industry? Just imagine: we might be using our Garmin maps app on our phones for directions today! Thus, understanding trends is critical for a brand to stay fresh and competitive. ”

Sign up for our newsletters here!

Follow our social media accounts:

Twitter: https://twitter.com/provokeinsights

Facebook: https://www.facebook.com/provokeinsights/

LinkedIn: https://www.linkedin.com/company/provoke-insights

Check out our most recent features in the news media:

September 11th, 2019: 40% of U.S. Millennials prefer crypto investments in the event of a recession: eToro Survey

July 31st, 2019: Jewelry Is About to Get its Own ‘Got Milk’ Ads

July 1st, 2019: 22 Top Advertising Research Companies 2019

Keep on the lookout for more blog posts from us!